Analysis
-
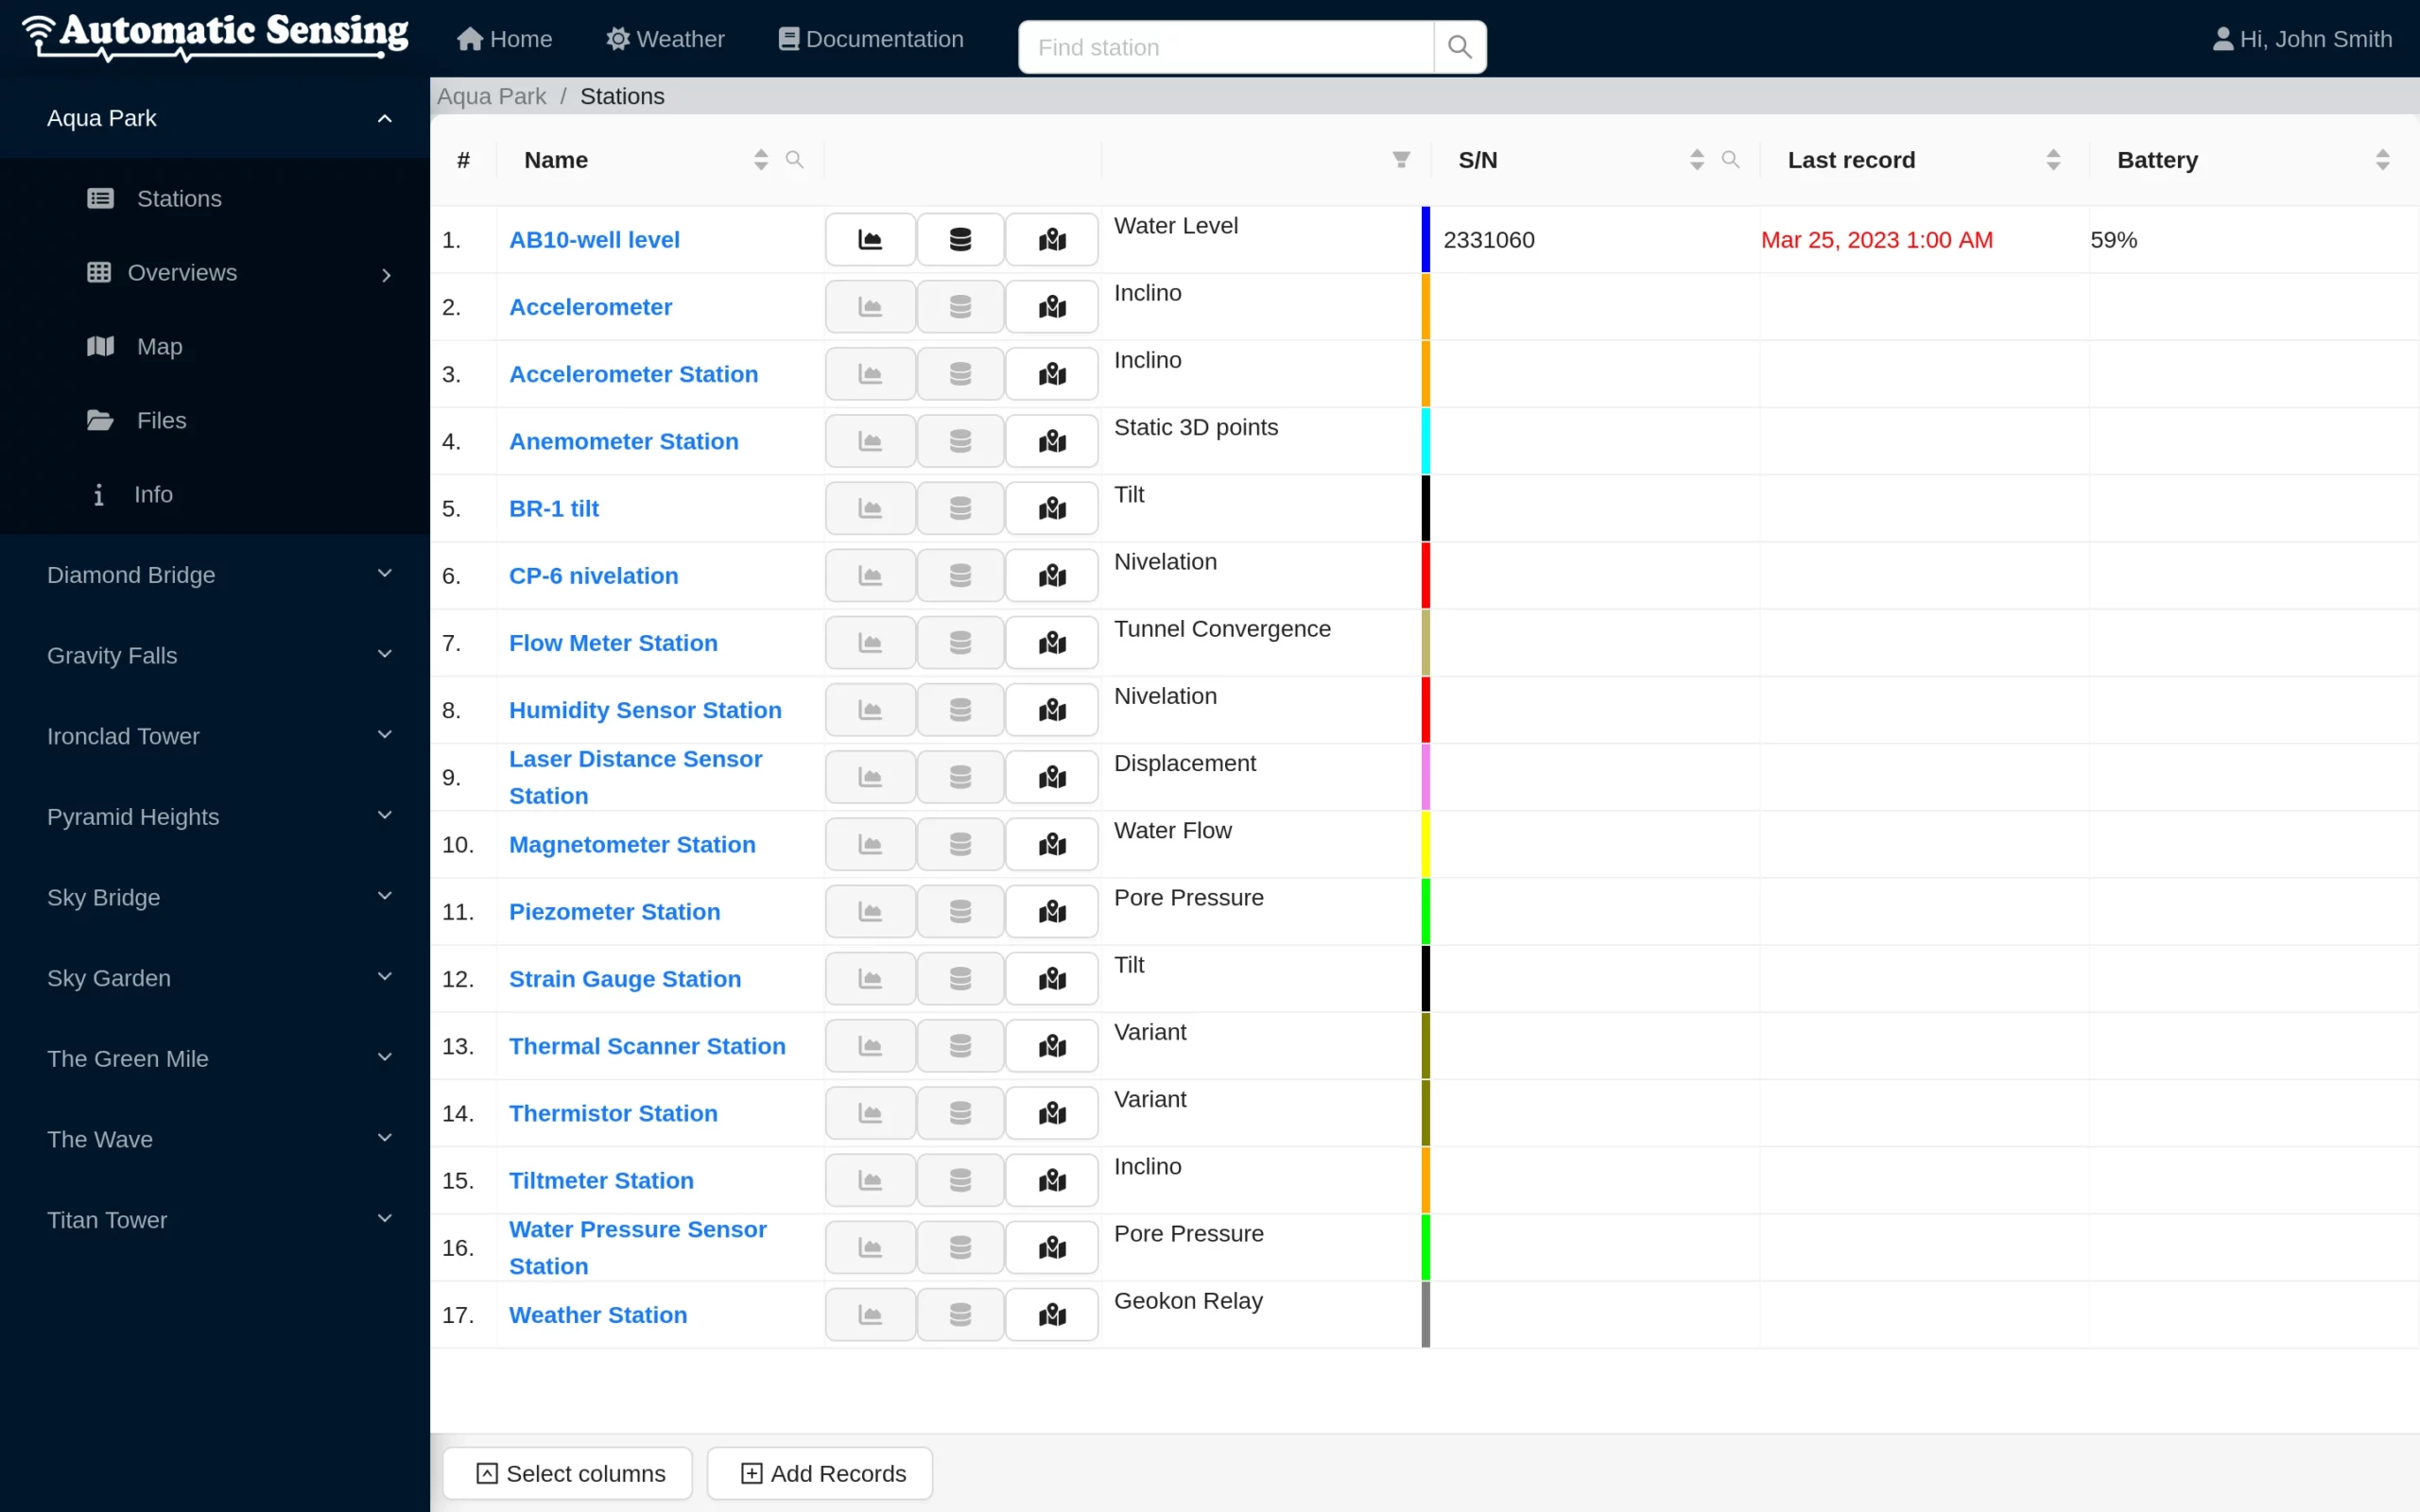
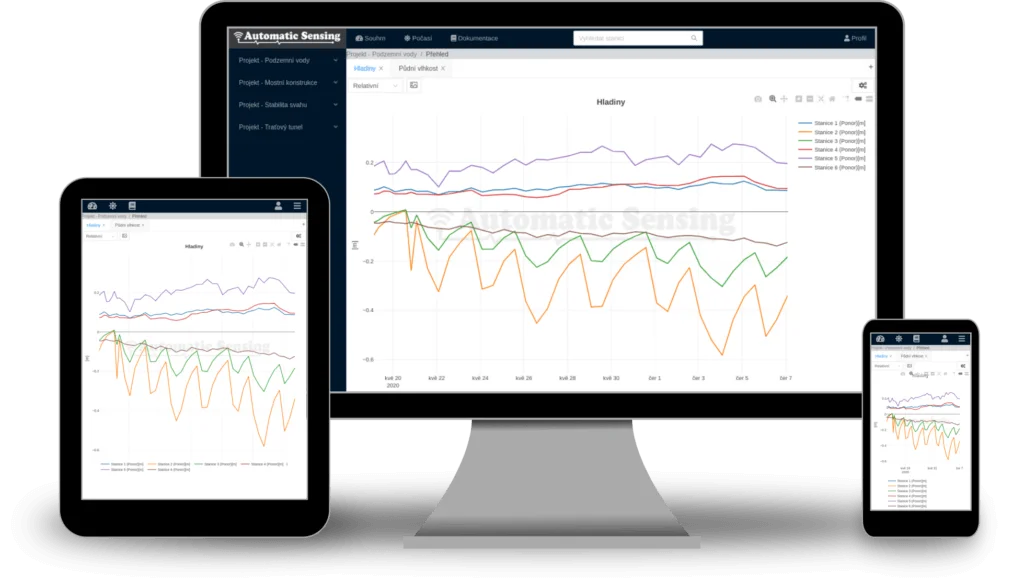
- Analytical overview of data with graphs and visualizations of measured values
-
- Visualisation of 3D points and levelling in space and on maps
-
- Comparison of measured values between each other and between stations
-
- Many chart types and export options
-
- Bulk export of graphs to MS Word templates

Data
-
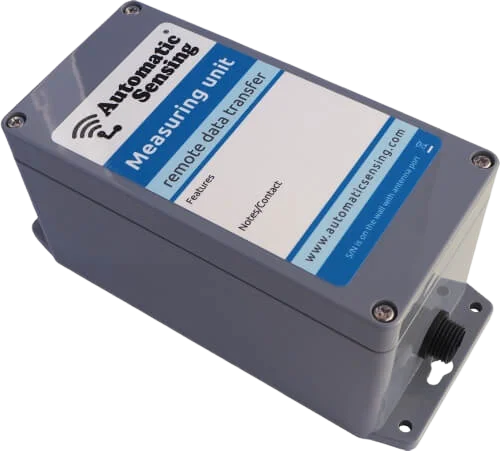
- Automated storage of project data from measuring stations
-
- Project and station-specific file storage
-
- Project and station-specific file storage
-
- Email and application notifications when preset values are exceeded
-
- Data export to MS Excel, CSV, ODS

System
-
- Regular updates
-
- Support for Chrome, Edge, Firefox and Safari on desktop and mobile
-
- Automatic data backup
-
- REST interface for M2M communication